![smartbarrel-logo-1.png]](https://ask.smartbarrel.io/hs-fs/hubfs/smartbarrel-logo-1.png?height=39&name=smartbarrel-logo-1.png)
Steps to view the Productivity Report.
Step 1: Find the report
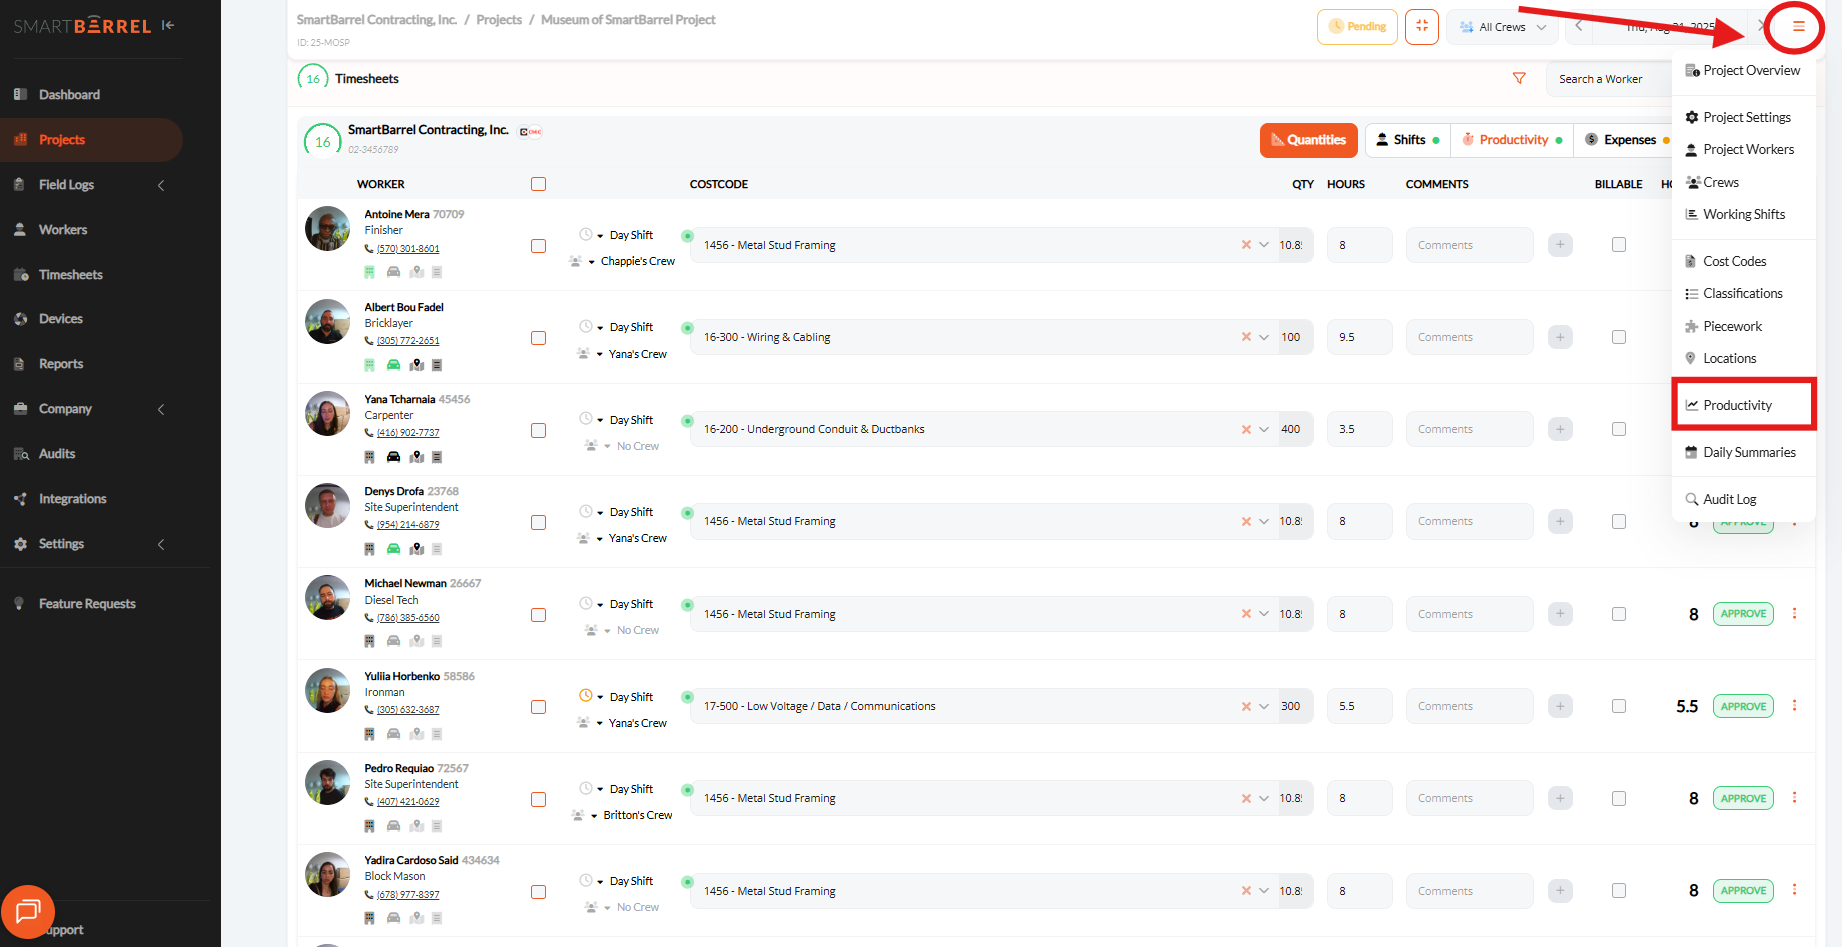
Go to the project and, from the top-right menu, select "Productivity". The report will display a chart showing the progress based on hours and quantities, along with key metrics for productivity, efficiency and performance.
Step 2: Review Report
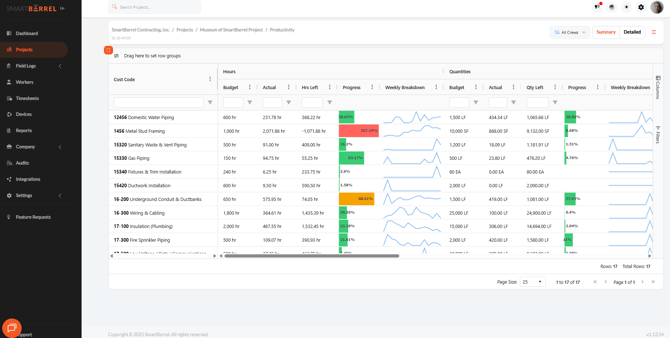
The report is organized with 1 row per cost code to the project. Each cost code is then broken down by Hours, Quantities, Productivity, and Performance Metrics.
- Hours and Quantities
- Budget, Actual, Hours left, Progress, and Weekly Breakdown.
- Productivity
-
- Budget: Represents the planned rate of production per labour hour. This set the target pace your crew is expected to maintain to stay within the budgeted hours.
- Actual: Indicates the actual output achieved per labor hour on-site. A higher rate means your crew is completing more work per hour, showing better productivity in the field.
- Efficiency: Measures how your actual output per hour compares to what was planned. A value over 100% means your crew is producing more per hour than expected, indicating higher efficiency.
4. Performance Metrics:
-
- Earned Hours: Represent the number of labor hours you should have used to complete the installed quantities based on the planned production rate. It is a core metric for evaluating labor performance and comparing it to actual hours spent.
- Forecasted Hours: Represent the total number of labor hours you are projected to need to complete the cost code, based on current field performance. If forecasted hours exceed your budget, you are trending toward a labor overrun.
- Hours Variance: Indicates whether you are trending over or under your labor budget based on current productivity. A positive value means you are expected to finish under budget (good). A negative value signals a likely overrun (bad).
- Burn Rate: The percentage of labor hours used so far. If over 100% labor is being spent faster than planned.
- Remaining Forecasted Hours: The number of hours still expected to be needed to finish the work, based on current productivity. Helps forecast labor demand.
- Production to Date (%): The percentage of total planned work that has been completed. A quick view of job progress for each cost code.
Note: Definition for each metric is available on the report itself by hovering on the info button.
Step 3: Exporting the Productivity Report
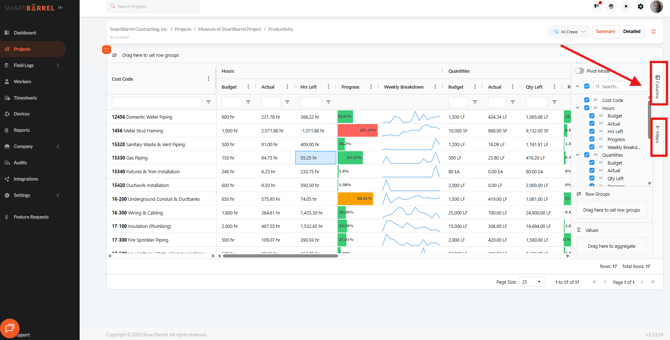
- Once the information is visible, you can customize the report by selecting different columns and values on the right side of the table.
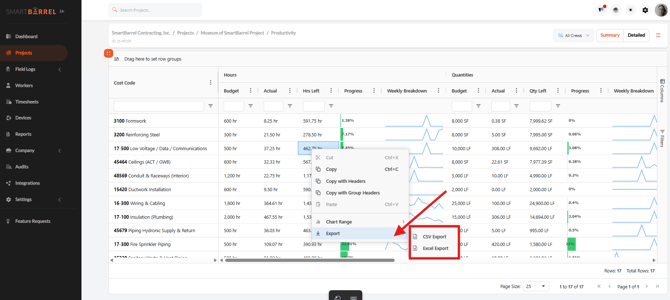
- To export the report, right-click within any cell and choose the desired export format. Press Ctrl+A to select the entire table before exporting.
Video: